Visuals help to quickly communicate our findings and get resources approved for implementation.
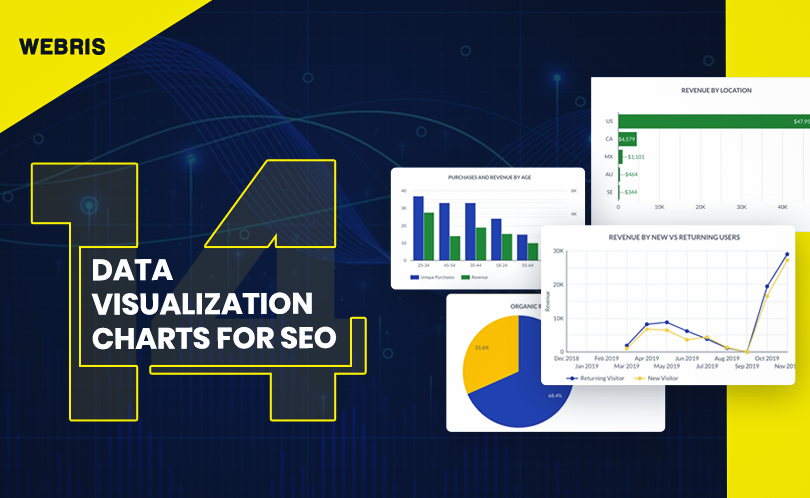
This blog post will cover our 14 favorite data visualization tactics for managing SEO data, along with some helpful links to incorporate them into your organization’s practice.
1. LINKSCAPE RELATIONSHIP ANALYSIS
By far one of my favorite SEO visualizations. Use it to spot issues with canonical tags, orphaned pages and internal link deficiencies. Personally, I like to use it during link building audits to display the most powerful pages on a site and how those pages and redistributing equity via internal links. Although there’s a slight learning curve to build the chart, there’s a TON of actionable ways to use this data.
